In This Update: Investment Spotlight | Stock Market Review | Economic Review & Outlook
Chart of the Month | Closing Statements

INVESTMENT SPOTLIGHT
Financial Markets Have Been King of the Hill, Regardless of Political Affiliation
There are certain factors that tend to have a discernible influence on financial market cycles and stock market returns, most notably – monetary policy impacts on financial conditions, the level of interest rates and financial system shocks. As it turns out, the statistical significance of which party is in the White House is quite low relative to stock market outcomes. Leadership in the White House is undoubtedly crucial to our country on all kinds of important fronts, but historical data show that stock market returns is not one of them. Neither party can claim to have had historical dominance over favorable economic periods or positive market performance. In fact, all presidential terms from the late 1950s to present, regardless of which side of the aisle the Commander and Chief is from, have occurred during periods of positive economic growth and the vast majority have been associated with strong stock market returns. When a presidential term begins with respect to economic cycles seems to matter more than any government policies or other factors with respect to subsequent stock market results.
MARKET INDEX RETURNS | November 2023 | YTD 2023 |
S&P 500 Index | 9.1% | 20.8% |
Russell 2000 Index | 9.0% | 4.1% |
MSCI EAFE Index | 9.3% | 12.3% |
Bloomberg US Agg. Bond Index | 4.5% | 1.6% |
FTSE 3 Mo. T-Bill Index | 0.5% | 4.8% |
U.S. equities provided long-term investors above average double digit annualized returns through both the Biden and Trump presidential administrations
STOCK MARKET REVIEW & OUTLOOK
“Keep Your Eyes on the Stars and Feet on the Ground” – Theodore Roosevelt
Much like the lesser-known quote above (after “Speak softly and carry a big stick.”) from our 26th (and youngest) President of the United States, investors have needed to look straight up to follow the trajectory of the stock market over the past five months. Hopefully, most are maintaining a firmly grounded stance with respect to the risks associated with owning assets that are capable of appreciating at such a rapid clip.
The S&P 500 closed the final trading session of March at another all-time high and booked its fifth consecutive monthly gain. Market breadth widened away from the strength of the largest of the large “magnificent” technology and media stocks with Energy stocks leading the way sailing the wind of higher oil prices at their backs. Other (similarly unflashy) sectors in favor during the month from the more cyclical and rate sensitive components of the index were Utilities, Materials and Financials. The shift in sector leadership and market breadth led to outperformance of the broad-based S&P 500 Index over the highflying Nasdaq Composite for March as well as through the first full quarter of the year.
The yield on the 10-Year U.S. Treasury closed the month at 4.21%, five basis points lower than where it started and toward the midpoint of the monthly trading range of 4.08 – 4.33%. The yield curve stood at a 42 basis point inversion between the 2 and 10-Year maturities. Futures market activity shows us that traders are beginning to get in step with a Fed indicating a bias toward cutting short-term rates later in the year.
S&P 500 SECTOR RETURNS | November 2023 | YTD 2023 |
Communication Services | 7.8% | 48.7% |
Consumer Discretionary | 10.9% | 34.1% |
Consumer Staples | 4.1% | -2.1% |
Energy | -1.0% | -1.3% |
Financials | 10.9% | 6.4% |
Healthcare | 5.4% | -2.2% |
Industrials | 8.8% | 10.4% |
Information Technology | 12.9% | 52.0% |
Materials | 8.4% | 7.6% |
Utilities | 5.2% | -8.8% |
ECONOMIC REVIEW & OUTLOOK
Latest Housing Data Showed a Glimpse of Spring After a Sustained Period of Frosty Reports
Existing Home Sales rebounded from a deep winter freeze, higher by 9.5% on a month-over-month basis in February, well ahead of expectations of ongoing hibernation. Housing Starts also rebounded higher by 10.7% after weather-related weakness noted in the first month of the year. This is the highest level since last May. Builders are citing renewed interest in new home permits with mortgage rates dipping below 7% and a continued limited amount of inventory of homes for sale. Should the pullback in borrowing rates continue under a Fed expressing a willingness to ease up on monetary policy, the housing market would certainly be a key beneficiary.
CHART OF THE MONTH
Stocks Have Provided Exceptional Returns Under Both Political Parties
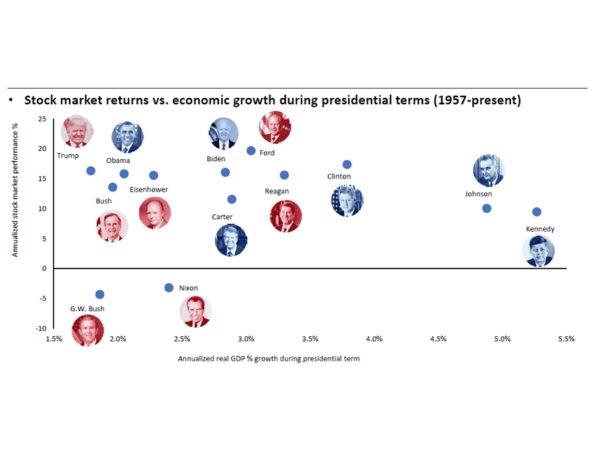
Sources: Haver and Invesco
As shown in the exhibit above, U.S. stocks have provided historically strong returns (for the majority of our lifetimes) regardless of who the president has been. The two periods of negative returns (out of the 13 different presidential administrations above) happen to have coincided with periods of deep economic recession, specifically the mid-1970s and 2008. As should be expected with the return of any risk asset, the positive results came with a fair amount of volatility. In fact, equities experienced a trailing 12 month pull back of 15-20% during all but one of the highlighted administrations (Eisenhower).
CLOSING STATEMENT
Looking Ahead
Investors considering “sitting out” the stock market if their particular party or candidate does not control the White House may be swayed against such panicked action by an interesting data analysis on “partisan portfolios” done by our fellow data enthusiasts at Invesco. Consider an investment of $10,000 in the Dow Jones Industrial Average made some 123 years ago. A portfolio that remained fully invested during that time period would now be valued at an astonishing $9.9 million. The “partisan portfolios” (invested either only during Democratic or only Republican administrations), on the other hand, would be worth less than $600,000 each. What a fine example of the power of working together across party lines.
Our presidential elections continue to be as important now as those of our forefathers who shaped the government of our great country. In November, we should all be focused on exercising our right to vote…and staying invested.
Please reach out to one of your Account Officers or any member of our Executive Leadership Team to discuss topics raised in this letter or if we can assist you in any other way.
Meet The Plimoth Investment Advisors Executive Leadership Team

Steven A. Russo, CFA
President & Chief Executive Officer
508‑591‑6202
srusso@pliadv.com

Louis E. Sousa, CFA
Senior Vice President & Chief Investment Officer
508‑675‑4313
lsousa@pliadv.com

Edward J. Misiolek
Senior Vice President & Operations Officer
508‑675‑4316
emisiolek@pliadv.com

Teresa A. Prue, CFP®
Senior Vice President & Head of Fiduciary Services and Administration
508‑591‑6221
tprue@pliadv.com
