In This Update: Investment Spotlight | Stock Market Review | Economic Review Chart of the Month | Closing Statements

INVESTMENT SPOTLIGHT
The Yield Curve is Flashing Yellow as Bonds Have Struggled for Direction
With the Fed signaling higher rates to come, investors shifted out of bonds in March, driving prices down and yields up. The 10-Year U.S. Treasury experienced the worst quarterly total return since 2009. The shorter end of the yield curve (more directly impacted by Fed policy) was hit harder. The 2-Year U.S. Treasury suffered the worst quarterly drawdown since 1984. The dramatic rise in short rates has the closely watched spread between the 2-Year and 10-Year Treasury inverted at the time of this writing. Short-term Treasury rates exceeding intermediate-term rates has historically been a warning sign for future economic growth.
The tightrope the Fed must walk on Monetary Policy decisions has become more challenging. Although past inversions of the yield curve have predated numerous recessions, there is insufficient data to claim that the phenomenon caused these periods of negative economic growth. Even if investors buy into an expectation of this current warning signal leading to recession, history shows us the lead up time has been significantly varied. For example, a curve inversion in 2019 was followed by a recession in as short as 7 months (albeit related to the exogenous shock of COVID lockdowns), while a similar interest rate anomaly in 1998 happened 33 months before GDP turned negative for two consecutive quarters (the textbook definition of a recession.) It is difficult to draw meaningful actionable conclusions when looking at other recessions occurring 16, 10, 18 and 22 months after curve inversions in 1978, 1980, 1988 and 2006 respectively.
MARKET INDEX RETURNS | MARCH 2022 | YTD 2022 |
S&P 500 Index | 3.7% | -4.6% |
Russell 2000 Index | 1.2% | -7.5% |
MSCI EAFE Index | 0.6% | -5.9% |
Barclays US Agg. Bond Index | -2.8% | -5.9% |
FTSE 3 Mo. T-Bill Index | 0.0% | 0.0% |
If the Fed sticks to their stated policy tightening plan, it will be the most aggressive pace of rate increases in 15 years.
STOCK MARKET REVIEW & OUTLOOK
While Stocks in the U.S. Showed Resilience
The S&P 500 recovered some of the ground lost earlier in the year, higher by 3.7% in March, but still in the red year-to-date by -4.6%. The negative quarterly return snapped a seven-quarter win streak for the bellwether stock index. The NASDAQ Composite took a similar path during the month, fighting its way out of bear market lows while still off by -8.9% through the first quarter of 2022. This is the greatest quarter of underperformance for the technology-focused NASDAQ relative to the S&P 500 since 2006. Strength in the more defensive and commodity-driven sectors of the market such as Energy, Utilities, Materials and Healthcare drove the performance disparity over more growth-oriented Information Technology stocks in the final month of the quarter.
Stocks outside of the U.S. struggled to regain ground. A surge in the new Omicron Coronavirus variant weighed on stocks in Europe and Asia. Major lockdowns are still taking place in parts of China where even family pets in Shanghai have been remanded to quarantine. A return of hyper-strict COVID policies with our critical international trading partners is sure to weigh on already stressed supply chain issues.
S&P 500 SECTOR RETURNS | MARCH 2022 | YTD 2022 |
Communication Services | 1.0% | -11.9% |
Consumer Discretionary | 4.9% | -9.0% |
Consumer Staples | 1.8% | -1.0% |
Energy | 8.9% | 39.0% |
Financials | -0.2% | -1.5% |
Healthcare | 5.6% | -2.6% |
Industrials | 3.4% | -2.4% |
Information Technology | 3.5% | -8.4% |
Materials | 6.1% | -2.4% |
Utilities | 10.4% | 4.8% |
ECONOMIC REVIEW & OUTLOOK
Jobs are Getting Filled but Not as Quickly as Mortgage Rates are Rising
Unemployment in the U.S. dropped to a new post pandemic lockdown low of 3.6%. The March payrolls report showed an increase of 431k jobs. This is the 11th consecutive month of new jobs reported above 400k, a remarkable run of growth not seen since 1939. Labor Force Participation ticked up modestly to 62.4%. It will, however, take more willingness on the part of workers to reenter the workforce to meet the demand for unfilled jobs, which stand at a near-record high level of 11.26 million.
The market’s reaction to the first in a series of anticipated rate hikes has sent borrowing costs sharply higher. Mortgage rates quickly jumped to the highest level since December 2018 with the average 30-year fixed rate mortgage soaring from 3.22% at the beginning of the year to 4.67% at the end of the first quarter. That type of jump should start to cool the red-hot real estate market but doesn’t exactly fall into the “soft landing” playbook the Fed has in mind with only one rate move under their belt and the mere mention of the unwinding of excessive purchases of mortgage-backed-securities.
CHART OF THE MONTH
Bond Market Volatility Outpaced Stock Volatility at Quarter End
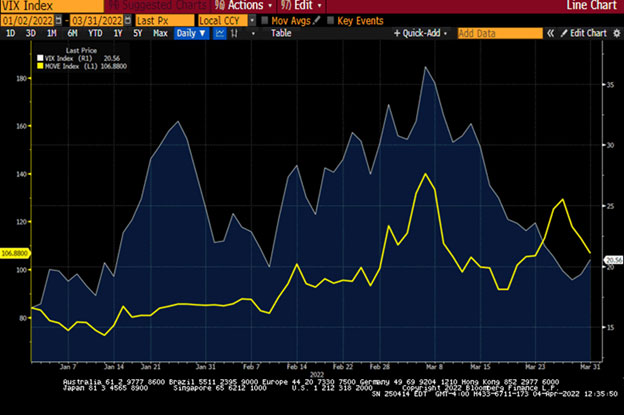
Source: Bloomberg
In an unusual risk reversal, volatility settled back down in the equity market (represented by the VIX Index in blue) while bond market volatility spiked (represented by the MOVE Index in yellow) during one of the worst routs for U.S. bonds in decades.
CLOSING STATEMENT
Looking Ahead
At the time of this writing, the war in Ukraine continues to devastate the region and shock the world with images of suffering and destruction. While the outcome is far from certain, U.S. equity markets have fully recovered losses incurred at the time of Russia’s invasion. On average, for the worst geopolitical events going back to the 1940s, the S&P 500 has drawn down -5%, taken 20 days to bottom and 43 days to recover. Through the end of March, a mere 25 trading days after Russia’s initial invasion, the index was 5.6% higher.
Of course, there have been numerous more painful, drawn-out recoveries throughout history, but newer investors have learned a lesson over the past two years with far fewer scars than seasoned industry professionals. Stock markets are resilient through time. This ties into the age-old sound advice that “time in the market” not “market timing” is the key to compounding attractive returns on capital.
Please reach out to one of your Account Officers or any member of our Executive Leadership Team to discuss topics raised in this letter or anything else we can be helpful with.
Meet The Plimoth Investment Advisors Executive Leadership Team

Steven A. Russo, CFA
President & Chief Executive Officer
508‑591‑6202
srusso@pliadv.com

Louis E. Sousa, CFA
Senior Vice President & Chief Investment Officer
508‑675‑4313
lsousa@pliadv.com

Edward J. Misiolek
Senior Vice President & Operations Officer
508‑675‑4316
emisiolek@pliadv.com

Teresa A. Prue, CFP®
Senior Vice President & Head of Fiduciary Services and Administration
508‑591‑6221
tprue@pliadv.com
