In This Update: Investment Spotlight | Stock Market Review | Economic Review & Outlook
Chart of the Month | Closing Statements

INVESTMENT SPOTLIGHT
Don’t Start Planning to Line up by License Plate Number Again Anytime Soon
Stagflation occurs when economic growth slows, and both inflation and unemployment rise to undesired levels. The last time the U.S. experienced an environment of persistent stagflation was in the 1970s, with rising inflation and high unemployment triggered during the oil crisis created by the Organization of the Petroleum Exporting Countries (OPEC) oil embargo and exacerbated by war spending expanding federal budget deficits. Those of you with memories of sitting in unimaginably long lines at the gas pumps (perhaps with parents providing exasperated colorful commentary on the state of the economy) to purchase rationed gasoline (on odd and even days based on license plate number) will perhaps have a vivid recollection of this time, as this writer does.
The key concern about entering a period of stagflation is that it is particularly difficult to combat using standard monetary policy tools as rising inflation is typically addressed by raising interest rates and a slowing economy with high unemployment by lowering them. This is a challenging conundrum for policy makers to effectively navigate under any circumstances but meaningfully intensified by one-off economic shocks like a commodity crisis or potential major disruption of global trade like we are now facing.
MARKET INDEX RETURNS | March 2025 | YTD 2025 |
S&P 500 Index | -5.6% | -4.3% |
Russell 2000 Index | -6.8% | -9.5% |
MSCI EAFE Index | -0.4% | 6.9% |
Bloomberg US Agg. Bond Index | 0.0% | 2.8% |
FTSE 3 Mo. T-Bill Index | 0.4% | 1.1% |
“A smooth sea never made a skilled sailor.” Franklin D. Roosevelt
STOCK MARKET REVIEW & OUTLOOK
Trade War Threats Weighed Heavily on Financial Markets
Equity markets continued to pull back in March, led lower by the once high-flying mega-cap technology stocks that were investor favorites in the seemingly unstoppable growth stock bull run of 2023 and 2024. The growthiest segments of the S&P 500 (Consumer Discretionary, Information Technology and Communication Services) were the biggest detractors over the month. Energy stocks added to their gains from prior months as the strongest sector with investors seeking companies with strong cash flows and the ability to potentially hedge against tariff driven inflation. Traditionally defensive Utilities stocks joined the mix as the only other sector in the green in March.
Heightened volatility in the U.S. sent some investors seeking diversification in overseas markets, particularly in Europe where equity valuations remain attractive and stimulative government spending plans may rejuvenate economic growth. The MSCI EAFE Index of developed non-U.S. companies meaningfully outperformed U.S. stocks in March and is well ahead in the first quarter of 2025. The S&P 500 underperformance relative to a basket of non-U.S. stock market returns (MSCI All Country World Ex-U.S. Index) in the first quarter was the widest since 2009.
The yield on the bellwether 10-Year U.S. Treasury was mostly flat during the month, closing just a basis point lower at 4.21%. The 2-Year ended lower by 11 basis points to 3.89%. Heightened risk-off sentiment since then has investors seeking the safety of U.S. Treasuries, driving yields down further at the time of this writing.
S&P 500 SECTOR RETURNS | March 2025 | YTD 2025 |
Communication Services | -8.3% | -6.2% |
Consumer Discretionary | -8.9% | -13.8% |
Consumer Staples | -2.4% | 5.2% |
Energy | 3.9% | 10.2% |
Financials | -4.2% | 3.5% |
Healthcare | -1.7% | 6.5% |
Industrials | -3.6% | -0.2% |
Information Technology | -8.8% | -12.7% |
Materials | -2.6% | 2.8% |
Utilities | 0.3% | 4.9% |
Real Estate | -2.4% | 3.6% |
ECONOMIC REVIEW & OUTLOOK
Consumer “Soft” Data Just Got Softer
When it comes to economic metrics, there are two types incorporating hard data and soft data. “Hard” data does not mean hard to swallow, although at times it could be. It simply means it is derived from statistical measures of actual economic outcomes (think retail sales, employment, and manufacturing data.) “Soft” data comes from surveys, so is subjective and can vary meaningfully, based upon exactly who is being asked to participate.
The (soft) Consumer Sentiment data, as surveyed by the University of Michigan, has meaningfully weakened of late, reaching the lowest level in three years. The latest headline reading of the Conference Board Consumer Confidence survey also pulled back to levels not seen since the pandemic. Survey participants are asked to respond based on their current perceptions and forward expectations. The later measure with an eye toward the future dropped remarkably to a 12-year low.
CHART OF THE MONTH
Sentiment and Confidence are Falling Like Pastel-colored Objects from an Excited Toddler’s Basket During an Easter Egg Hunt
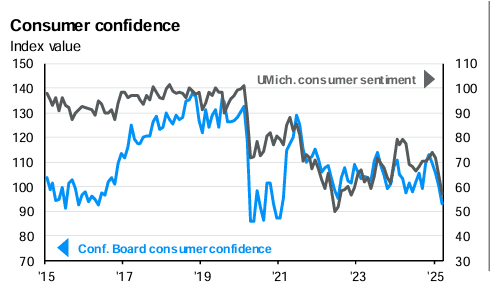
Source: JP Morgain Guide to the Markets
CLOSING STATEMENT
Looking Ahead
If recently outlined reciprocal tariff levels by the President stick, combined tariffs across all countries the U.S. imports from will be at the highest level in over 100 years. The situation is certainly “fluid” as officials from our most impacted trading partners respond. One would hope that through compromise and negotiation a full-on trade war would be avoided. If not, supply chain disruptions and product input price spikes will reverberate across industries and risk pushing the U.S. to the brink of recession, far from the consensus base case only weeks ago. In that scenario, we would expect the Fed to back burner its efforts on lowering inflation and cut rates to lead the economy to more stable footing, the opposite of what Fed Chairman Paul Volcker did (raising rates) in the 1970s, leading to a painful recession into the 1980s.
Times of dramatically heightened market volatility are when long-term investors can rely on sound financial plans put in place during more rational times. While understanding the near-term impacts on industries and companies is important, sticking to solid fundamental investment practices and holding a diversified mix of only the highest quality companies will help portfolios weather this and future storms.
Please reach out to one of your Account Officers or any member of our Executive Leadership Team to discuss topics raised in this letter or if we can assist you in any other way.
As always, please feel free to join the conversation on our socials – Facebook and LinkedIn!
Meet The Plimoth Investment Advisors Executive Leadership Team

Steven A. Russo, CFA
Chairman of the Board
508‑591‑6202
srusso@pliadv.com

Louis E. Sousa, CFA
President & Chief Executive Officer
508‑675‑4313
lsousa@pliadv.com

Mark J. Gendreau, CFP ®
Senior Vice President & Chief Investment Officer
508-591-6211
mgendreau@pliadv.com

Edward J. Misiolek
Senior Vice President & Operations Officer
508‑675‑4316
emisiolek@pliadv.com

Teresa A. Prue, CFP®
Senior Vice President &
Head of Fiduciary Services and Administration
508‑591‑6221
tprue@pliadv.com
