In This Update: Investment Spotlight | Stock Market Review | Economic Review Chart of the Month | Closing Statements

INVESTMENT SPOTLIGHT
The Fed Says What It Does, Then Does What It Says
The Federal Open Market Committee (FOMC) voted to raise short-term interest rates by 75 basis points in their September meeting. The move was transparent, well communicated and nearly etched in stone. The announcement of the unanimous decision should have surprised no one, but still precipitated a spike in bond market volatility, as measured by the Merrill Lynch Option Volatility Estimate (MOVE) Index, to near record highs. The hawkish tone and reference to stickier than anticipated inflation added fuel to the fire that had been smoldering and reigniting throughout the year.
The 10-Year U.S. Treasury briefly breached a 4% yield for the first time in over a decade. U.S. government bond yields across the curve rose at a pace that most market participants have only read about (unless they have been at it for over 40 years). When the dust settled in the final trading session of the month (and quarter), the bellwether Treasury Note closed with a yield of 3.83%.
MARKET INDEX RETURNS | SEPTEMBER 2022 | YTD 2022 |
S&P 500 Index | -9.2% | -23.9% |
Russell 2000 Index | -9.6% | -25.1% |
MSCI EAFE Index | -9.4% | -27.1% |
Barclays US Agg. Bond Index | -4.3% | -14.6% |
FTSE 3 Mo. T-Bill Index | 0.2% | 0.6% |
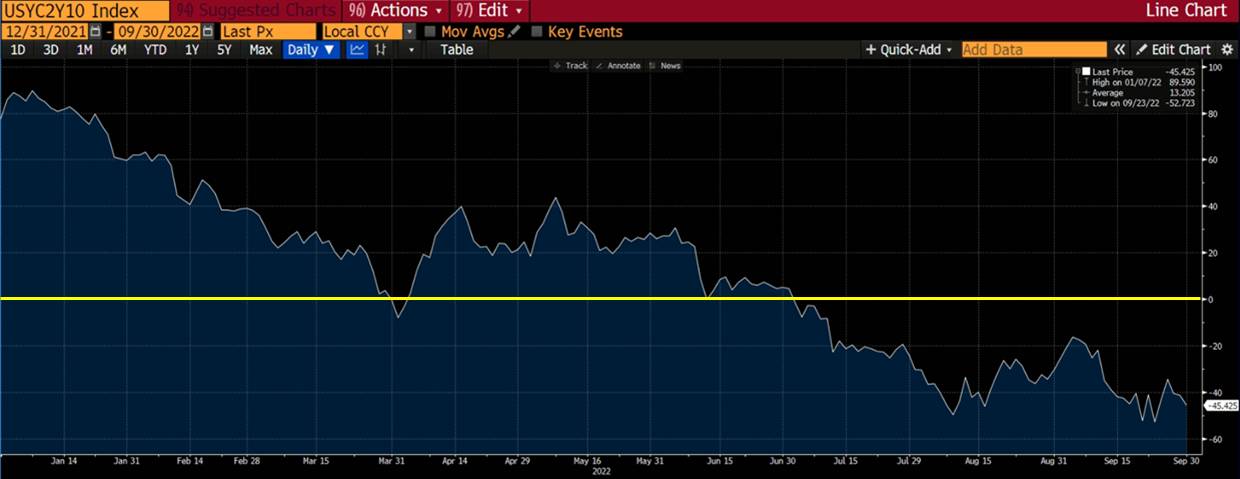
A rise in short-term rates further widened the inversion of the spread between the 2-Year and 10-Year U.S. Treasury rates.”
STOCK MARKET REVIEW & OUTLOOK
Equity Markets Had a Bear of a Time Last Month
U.S. equities reached the lows of the year after a sharp selloff in September that left no sectors of the stock market unscathed. Investor sentiment dropped and volatility spiked across global financial markets, taking equity and bond investment valuations lower in the process. Cash investments went from “trash” (as some overly quoted pundits on Wall Street have said) to “king” as the only safe haven which protected capital during the tumult.
In such environments, perhaps a new acronym would be appropriate relating to investing to the “NTH” degree, which I would describe as investing when there is “Nowhere To Hide” in financial markets. If such a phrase is eventually coined by talking heads, thank you for sharing as (to my knowledge) this is the first time it is in print.
S&P 500 SECTOR RETURNS | SEPTEMBER 2022 | YTD 2022 |
Communication Services | -12.2% | -39.0% |
Consumer Discretionary | -8.1% | -29.9% |
Consumer Staples | -8.0% | -11.8% |
Energy | -9.5% | 34.5% |
Financials | -7.8% | -21.3% |
Healthcare | -2.6% | -13.1% |
Industrials | -10.5% | -20.7% |
Information Technology | -12.0% | -31.4% |
Materials | -9.4% | -23.8% |
Utilities | -11.3% | -6.5% |
ECONOMIC REVIEW & OUTLOOK
Housing Market Is Likely to Cool Further as Pumpkin Spice Flavored Hot Beverage Proliferation Takes Hold
The national average on 30-Year fixed rate mortgages reached 6.7%, a precipitous rise from the sub-three percent levels home buyers enjoyed only a year ago, and reminiscent of levels last experienced during the great financial crisis. The latest report of Existing Home Sales showed a 20% year-over-year decline. The more forward-looking measure of Building Permits has fallen off along with the National Association of Home Builders (NAHB) Builder Optimism Survey which declined for an eighth consecutive month. Zillow recently reported that home values are declining on a month-over-month basis for the first time in a decade. Even the most delicious pumpkin pie and pumpkin-spiced coffee is unlikely to draw much of a crowd of eligible buyers to open houses this fall.
CHART OF THE MONTH
Spread History Between the 2-Year and 10-Year U.S. Treasury Rates

Source: Bloomberg
The chart above shows the spread between the 2-Year and 10-Year U.S. Treasury yields. The measure dipped into negative territory in the first quarter and dropped to the lowest of the year (-51 basis points) in September. The move marked the widest inversion since the 1980s and is indicative of concerns about near-term economic growth.
CLOSING STATEMENT
Looking Ahead
We remain committed to holding (and continuing to identify) the most attractive equity positions to achieve investors’ objectives for long-term growth of capital. With that in mind, we have also increased the amount of time and resources spent on the analysis and purchase of other reasonable alternatives within the fixed income universe. The rise in yields of high quality, investment grade, corporate bonds has allowed us to take advantage of the most attractive opportunities in this segment of the market in years. We plan to continue to build out bond ladders in our client portfolios with a strategic allocation within short to intermediate-term maturities (2 to 6 years). Higher levels of recurring income will add incremental ballast to portfolios if the level of market volatility we have experienced throughout 2022 continues in the coming months.
Please reach out to one of your Account Officers or any member of our Executive Leadership Team to discuss topics raised in this letter or if we can assist you in any other way.
Meet The Plimoth Investment Advisors Executive Leadership Team

Steven A. Russo, CFA
President & Chief Executive Officer
508‑591‑6202
srusso@pliadv.com

Louis E. Sousa, CFA
Senior Vice President & Chief Investment Officer
508‑675‑4313
lsousa@pliadv.com

Edward J. Misiolek
Senior Vice President & Operations Officer
508‑675‑4316
emisiolek@pliadv.com

Teresa A. Prue, CFP®
Senior Vice President & Head of Fiduciary Services and Administration
508‑591‑6221
tprue@pliadv.com
