In This Update: Investment Spotlight | Stock Market Review | Economic Review & Outlook
Chart of the Month | Closing Statements

INVESTMENT SPOTLIGHT
Concentration in the S&P 500
As investors ponder valuations of the closely followed S&P 500 Index, which has hit 28 new record highs in the first three quarters of the year, they would be wise to consider its concentration. Not concentration as it relates to a childhood game (although maybe when Warren Buffet was a child, he used fun images for matching like Standard Oil, Woolworth and American Sugar, some of the original Dow 30 companies), but concentration in terms of the dominance of the largest stocks in the S&P.
The 10 largest stocks in the bellwether index now represent an eye-popping 40% of the overall market capitalization. Equally striking is the fact that over 32% of the earnings of the overall index are generated by these 10 companies (Nvidia, Apple, Microsoft, Amazon, Alphabet, Meta, Tesla, Broadcom, Berkshire Hathaway and JP Morgan.) The common factor across many of these companies is their focus on growth through innovative technologies. Investors have been enamored with anything with the initials “AI” in a press release or earnings call, and perhaps rightfully so. The power of artificial intelligence (AI), and particularly generative AI (creation of novel new content rather than analysis and synthesizing existing content) could revolutionize workflow technologies and processes across multiple industries. Investors’ willingness to pay up for potentially explosive future earnings in this area has led these top 10 names to a lofty valuation of 28.8x forward earnings, as measured by the price to earnings (P/E) ratio. The dominance of these positions in the index has pulled the overall index valuation up to 22.6x, well above historical averages. The good news for diligent stock pickers (not just Warren Buffett) is that when the other 490 stocks in the index are considered, valuations are much closer to long-term norms, trading at 20.7x forward earnings. This is still ahead of the 30-year historical average of 17x but is fertile ground for investors willing to dig into the details to find attractive opportunities despite concerns about record high index levels.
MARKET INDEX RETURNS | September 2025 | YTD 2025 |
S&P 500 Index | 3.6% | 14.8% |
Russell 2000 Index | 3.1% | 10.4% |
MSCI EAFE Index | 1.9% | 25.1% |
Bloomberg US Agg. Bond Index | 1.1% | 6.1% |
FTSE 3 Mo. T-Bill Index | 0.4% | 3.3% |
Forward P/E ratio is a measure of how much investors are willing to pay for $1 of future earnings of a company (stock price per share / earnings per share).
STOCK MARKET REVIEW & OUTLOOK
A Fed Back at the Rate Cutting Table Drove the Green on the Screen
Investors applauded the Federal Open Market Committee’s (FOMC) decision to restart the monetary easing cycle, after pausing since the fourth quarter of 2024, by cutting short-term interest rates by 0.25% at their latest meeting on September 17th. The S&P 500 advanced by over 3%, driven by gains in the growthiest segments of the market (Information Technology, Communication Services and Consumer Discretionary) along with Utilities stocks, now often referred to as the power source behind AI computing’s rapid expansion. While large cap U.S. stocks were the place to be during the run-up, diversified investors in small cap stocks generated strong returns and international stocks added to their formidable year-to-date gains as well.
S&P 500 SECTOR RETURNS | September 2025 | YTD 2025 |
Communication Services | 5.6% | 24.5% |
Consumer Discretionary | 3.2% | 5.3% |
Consumer Staples | -1.6% | 3.9% |
Energy | -0.4% | 7.0% |
Financials | 0.1% | 12.7% |
Healthcare | 1.8% | 2.6% |
Industrials | 1.8% | 18.3% |
Information Technology | 7.2% | 22.3% |
Materials | -2.1% | 9.3% |
Utilities | 4.2% | 17.7% |
Real Estate | 0.5% | 6.2% |
ECONOMIC REVIEW & OUTLOOK
Consumer Spending Showed No Signs of Frosting Over
Consumers were out in full force, spending on much more than their favorite pumpkin flavored goods. (Pumpkin spiced SPAM anyone? That seems a bridge too far but to each their own.) The latest reading of Retail Sales was stronger than anticipated with non-store sales leading the charge. Including the prior month’s revisions, year-on-year sales grew by 3.5%. The latest report on Durable Goods orders exceeded expectations as well, led by defense (and to a lesser but still impressive degree, commercial) aircraft orders. There was no mention of pumpkin spiced electronics, furniture or jewelry in the mix, but never say never! The rise in consumer spending was a key driver of the increase in the latest revision to second quarter estimated economic growth (GDP), which jumped from 3.3% to 3.8% on strong personal consumption, increasing 2.5%. The reading signifies an economy on solid footing that was quick to rebound after a modest pullback in the first quarter, driven by tariff front-running imports.
CHART OF THE MONTH
Capital Spending on AI is Expected to Continue at an Accelerating Pace
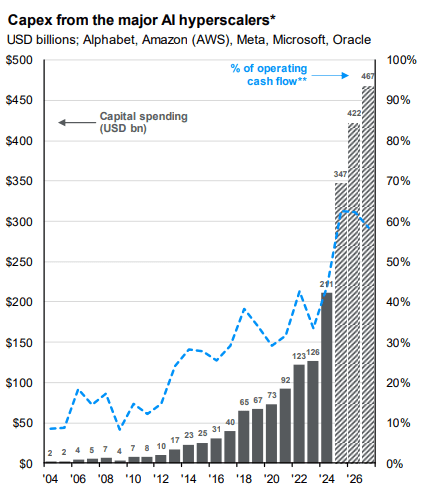
Source: J.P. Morgan Guide to the Markets
CLOSING STATEMENT
Looking Ahead
Despite elevated valuations for the largest U.S. growth stocks, there continues to be a place in portfolios for exposure to these potentially technological game-changing companies. Capital Expenditures by the largest cloud computing players in the space (as shown in the chart above) are expected to continue at a rapid pace, serving as a formidable tailwind to earnings. However, portfolio diversification remains key as speculative investors that quickly bid up these stocks can just as quickly jump ship on any headline deemed to be negative. We remain as enthusiastic as ever about the prospects of finding attractive stock investment opportunities in these well-traveled lanes, as well as off-the-beaten-path avenues which speculators often overlook.
We are anticipating continued vigilance on the part of the FOMC toward moving closer to a sustainable policy neutral rate (neither contractionary nor expansionary) and expect to be reporting on another 0.25% rate cut following their October meeting. Fed Governors will be challenged by more limited data than normal, given the impact of the government shutdown on critical reporting agencies, but barring any major surprises in available data points, the recently restarted easing cycle appears to have some legs through the end of the year.
Please reach out to one of your Account Officers or any member of our Executive Leadership Team to discuss topics raised in this letter or if we can assist you in any other way.
Meet The Plimoth Investment Advisors Executive Leadership Team

Steven A. Russo, CFA
Chairman of the Board
508‑591‑6202
srusso@pliadv.com

Louis E. Sousa, CFA
President & Chief Executive Officer
508‑675‑4313
lsousa@pliadv.com

Mark J. Gendreau, CFP ®
Senior Vice President & Chief Investment Officer
508-591-6211
mgendreau@pliadv.com

Edward J. Misiolek
Senior Vice President & Operations Officer
508‑675‑4316
emisiolek@pliadv.com

Teresa A. Prue, CFP®
Senior Vice President &
Head of Fiduciary Services and Administration
508‑591‑6221
tprue@pliadv.com
