In This Update: Investment Spotlight | Stock Market Review | Economic Review & Outlook
Chart of the Month | Closing Statements

INVESTMENT SPOTLIGHT
Silver and Gold Shimmered this Holiday Season
The longest U.S. government shut down in history, concerns about tariff impacts on inflation and a myriad of international relations headlines were solid fixtures in the “wall of worry” investors faced last year. Despite periods of volatility (most notably a stark pullback in April following “Liberation Day” tariff announcements), equity markets kept the bull run charging forward. Corporate stock buybacks (remarkably surpassing $1 trillion in the year) were a positive catalyst to the enthusiasm. The largest of the large growth companies (many keen to participate in the hottest M&A environment in some time) led the rally in the U.S. and international equities (led by more cyclically oriented sectors) were shining stars in investor portfolios during the year.
In an unusual turn, precious metals, normally associated with a safe haven “fear” trade, had stellar returns in the primarily “risk-on” year of 2025. The 64% increase in the price of gold is the best calendar year return since 1979. Silver (a commodity used in the creation of batteries and solar panels) was up an even more amazing 140%. A growing appetite for inflation hedges and a weaker U.S. dollar played into the price momentum of these luminous commodities. Oil prices, on the other hand, dropped by 20%, the most since 2020. In a year rife with geopolitical tensions, oversupply concerns and expectations for muted demand growth were key drivers of the weakness.
MARKET INDEX RETURNS | December 2025 | YTD 2025 |
S&P 500 Index | 0.1% | 17.9% |
Russell 2000 Index | -0.6% | 12.8% |
MSCI EAFE Index | 3.0% | 31.2% |
Bloomberg US Agg. Bond Index | -0.1% | 7.3% |
FTSE 3 Mo. T-Bill Index | 0.3% | 4.4% |
A spike in Google searches for the term “gold” reached record highs in October and November, suggesting interest by some “new to the game” investors in the precious metal commodity space.
STOCK MARKET REVIEW & OUTLOOK
Overseas Markets Made Big Waves in 2025
The S&P 500 eked out a positive return in December, to cap a third consecutive year of stellar double-digit returns. The 18% annual return, however, lagged overseas markets by the most since 2009. Investors continued to be drawn to the attractive valuations and solid earnings of non-U.S. stocks, buoyed by the tailwind of a weaker U.S. dollar. Despite a mixed bag of sectors returns in the U.S. in December, all provided positive returns for the year, with Communication Services and Information Technology the standout winners. As investors stepped on the gas, defensive stocks in the Consumer Staples sector were left in the dust, outperformed by bonds and even the most conservative cash investments with mid-single digit returns for the year.
The yield on the 10-Year U.S. Treasury finished December at 4.17%, 0.15% higher than where it started. The closing yield was modestly higher from the start of the year by 0.40%. The highly anticipated 0.25% cut in the Fed Funds Rate by the Federal Open Market Committee (FOMC) following their December 10th meeting (to a target range of 3.50-3.75%) had little to no impact on the intermediate part of the Treasury yield curve.
S&P 500 SECTOR RETURNS | December 2025 | YTD 2025 |
Communication Services | -1.0% | 33.6% |
Consumer Discretionary | 0.8% | 6.0% |
Consumer Staples | -1.6% | 3.9% |
Energy | 0.2% | 8.7% |
Financials | 3.1% | 15.0% |
Healthcare | -1.4% | 14.6% |
Industrials | 1.2% | 19.3% |
Information Technology | -0.3% | 24.0% |
Materials | 2.2% | 10.5% |
Utilities | -5.1% | 16.0% |
Real Estate | -2.2% | 3.1% |
ECONOMIC REVIEW & OUTLOOK
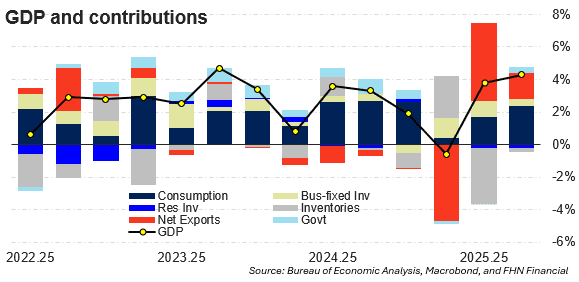
Third Quarter GDP Shined Brightest of All
Gross Domestic Product (GDP) growth in the third quarter surprised to the upside, much like the box office bonanza that took place following the release of the Wicked for Good movie (quickly jumping to number three on Billboard’s list of top grossing films adapted from Broadway musicals after its first month in theaters.)
The 4.3% annualized growth reading was the strongest in two years, led by strength in spending on services (like healthcare and movie theater experiences) and a decline in imports (like Wicked Witch of the West – Elphaba replica hats produced in China.) Consumer spending (3.5%), business fixed investment (2.8%), government spending (2.2%), and foreign trade (1.6%) were all solid contributors to growth, while residential investment (-5.4%) and inventories (-0.2) were detractors. Spending on structures continued to slide for a seventh consecutive quarter. Despite all the hype about new data centers and power generation to support AI innovation, spending on commercial office buildings and manufacturing structures continued to be the primary headwinds.
CHART OF THE MONTH
Key Drivers of GDP Strength
CLOSING STATEMENT
Looking Ahead
How active a U.S. Federal Reserve under new leadership will be in 2026, how sticky inflation responds to their stimulus, further developments in AI innovation and ongoing geopolitical tensions will all be top of mind for investors in the new year. These will be some of the key data points and areas of interest we will be diligently extracting from the relentless sea of headlines in the coming months. At the end of the day, sustainable corporate earnings growth will continue to be key to our fundamental analysis, with plenty of shine still visible on those stars.
Please reach out to one of your Account Officers or any member of our Executive Leadership Team to discuss topics raised in this letter or if we can assist you in any other way.
Side note from the “wicked good” third quarter GDP report above:
If you are wondering about the other two top-grossing Broadway-to-film adaptations, Mamma Mia, starring Meryl Streep, is second with worldwide gross earnings of $707 million and the original Wicked, released just over a year ago, continues to lead the rankings with $758 million.
Meet The Plimoth Investment Advisors Executive Leadership Team

Steven A. Russo, CFA
Chairman of the Board
508‑591‑6202
srusso@pliadv.com

Louis E. Sousa, CFA
President & Chief Executive Officer
508‑675‑4313
lsousa@pliadv.com

Mark J. Gendreau, CFP ®
Senior Vice President & Chief Investment Officer
508-591-6211
mgendreau@pliadv.com

Edward J. Misiolek
Senior Vice President & Operations Officer
508‑675‑4316
emisiolek@pliadv.com

Teresa A. Prue, CFP®
Senior Vice President &
Head of Fiduciary Services and Administration
508‑591‑6221
tprue@pliadv.com
