In This Update: Investment Spotlight | Stock Market Review | Economic Review & Outlook
Chart of the Month | Closing Statements

INVESTMENT SPOTLIGHT
Strong Energy and a Break from Old Patterns Have Played out in Equity Markets
U.S. equity index returns have certainly kicked off the year of the Fire Horse with “strong energy” returns. While the overall index has provided only mediocre gains, the Energy sector has been a standout winner in a continued rotation away from the high-flying growth stock leaders of last year and toward more cyclical and defensive areas of the market. Rising energy commodity prices and infrastructure investment have led to a galloping charge in the energy sector, while investors have also begun to favor old-economy industrial “smokestacks” over the technological components and software systems of modern data server racks.
MARKET INDEX RETURNS | February 2026 | YTD 2026 |
S&P 500 Index | -0.8% | 0.7% |
Russell 2000 Index | 0.8% | 6.2% |
MSCI EAFE Index | 4.6% | 10.1% |
Bloomberg US Agg. Bond Index | 1.6% | 1.7% |
FTSE 3 Mo. T-Bill Index | 0.3% | 0.6% |
“Smokestack” industries are traditionally associated with heavy manufacturing companies including machinery, steel and other metals, shipbuilding, autos and chemicals.
STOCK MARKET REVIEW & OUTLOOK
U.S. Equities Pulled Back on the Reins While International Stocks Stayed High in the Saddle
The S&P 500 pulled back modestly in the month of February, led lower by the growthiest segments of the market, Consumer Discretionary, Communication Services and Information Technology, as well as rate-sensitive Financials, which experienced a series of mixed earnings announcements. The “Magnificent Seven” (mega cap tech stocks) were lower by 7.3% during the month. That is the lowest monthly return for the former market leaders since March 2025. The tech rout pulled the Nasdaq Composite well into negative territory, while the (folksy) old-school Dow Jones Industrial Average eked out a modest gain. The S&P 500 Equal Weighted Index outperformed the Cap Weighted Index for a fourth consecutive month, a clear indication of improved breadth across individual stock returns. Non-U.S. equities continued to be standout winners in investors’ portfolios, already providing double-digit returns only two months into the calendar year.
The yield on the bellwether 10-Year U.S. Treasury pulled back by 0.30% to 3.94% during the month. This is the largest intermediate-term rate decline since February 2025, perhaps signifying a view of slowing economic growth by fixed income traders. A more moderate pullback at the short end of the yield curve seems indicative of the expectation for lower policy rates later in the year.
S&P 500 SECTOR RETURNS | February 2026 | YTD 2026 |
Communication Services | -5.1% | 0.4% |
Consumer Discretionary | -5.4% | -3.8% |
Consumer Staples | 7.9% | 16.3% |
Energy | 9.4% | 25.2% |
Financials | -3.7% | -6.1% |
Healthcare | 3.5% | 3.5% |
Industrials | 7.1% | 14.3% |
Information Technology | -3.9% | -5.5% |
Materials | 8.4% | 17.8% |
Utilities | 10.3% | 11.9% |
Real Estate | 6.4% | 9.4% |
ECONOMIC REVIEW & OUTLOOK
Consumer Price Inflation Slowed to a Steady Trot in the Latest Report
The latest Consumer Price Index (CPI) report from January came in lower than expected at 2.4%, down from the prior 2.7% reading. Energy prices declined 1.5% during the trailing 12 months (thanks to a 3.2% drop in gasoline prices), a welcomed respite for consumers prior to the recent spike following the escalation of the Middle East conflict. Services continued to be the primary driver of ongoing price increases, particularly hospital care. Consumers also faced higher prices for appliances and computer equipment.
CHART OF THE MONTH
Historical Components of CPI Inflation – Driven by the Cost of Services
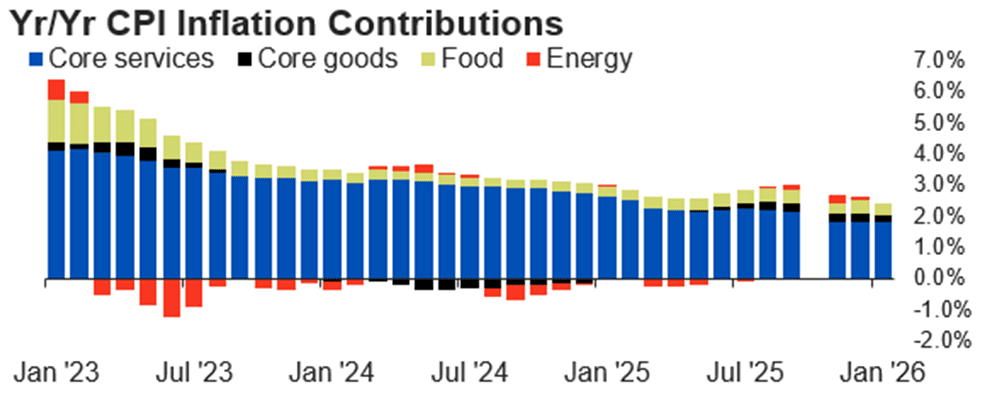
Source: Bureau of Labor Statistics, FHN Financial
CLOSING STATEMENT
Looking Ahead
Geopolitical risks will continue to take center stage in investors’ minds and dominate online headlines as air and water warfare continue to play out in the Middle East theater. Fed watchers will be keeping a close eye on the inflationary impacts of the conflict with crude oil prices having spiked over 50% from the start of the year (at the time of this writing). We sit squarely with consensus around the campfire that the Federal Open Market Committee will hold the line on short-term rate policy at their upcoming meeting later this month.
The year of the Fire Horse has started out with ample intensity and energy, keeping investors keenly aware of how rapidly financial market dynamics can shift. Steadfast long-term investors will keep a steady hand on the reins, ensuring that both rider and their portfolio reach their designated horizon.
Please reach out to one of your Account Officers or any member of our Executive Leadership Team to discuss topics raised in this letter or if we can assist you in any other way. As always, we welcome you to join the conversation on our social media sites – Facebook and LinkedIn.
Meet The Plimoth Investment Advisors Executive Leadership Team

Steven A. Russo, CFA
Chairman of the Board
508‑591‑6202
srusso@pliadv.com

Louis E. Sousa, CFA
President & Chief Executive Officer
508‑675‑4313
lsousa@pliadv.com

Mark J. Gendreau, CFP ®
Senior Vice President & Chief Investment Officer
508-591-6211
mgendreau@pliadv.com

Edward J. Misiolek
Senior Vice President & Operations Officer
508‑675‑4316
emisiolek@pliadv.com

Teresa A. Prue, CFP®
Senior Vice President &
Head of Fiduciary Services and Administration
508‑591‑6221
tprue@pliadv.com
